how far can we go with Minard’s map?!
 Like many others, I discovered Minard’s map of the catastrophic 1812 Russian campaign of Napoleon in Tufte’s book. And I consider it a masterpiece for its elegant way of summarising some many levels of information about this doomed invasion of Russia. So when I spotted
 Apart from the trivia about familial connection with the Russian campaign and the Berezina crossing which killed one of his direct ancestors, his great-great-grandfather, along with a few dozen thousand others (even though this was not the most lethal part of the campaign), he brings different perspectives on the meaning of
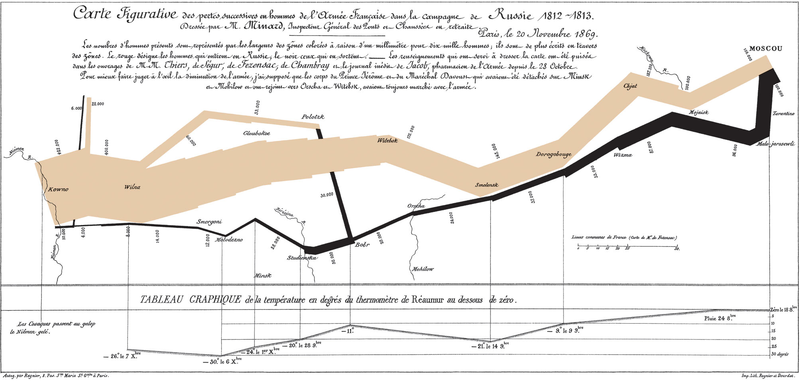
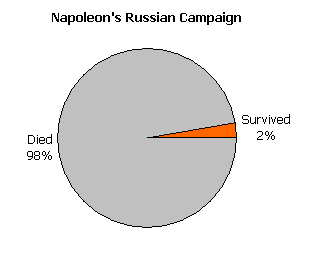 a map and the quantity of information one could or should display. This is not unlike other attempts at competiting with Minard, including those listed on Michael Friendly’s page. Incl. the cleaner printing above. And the dumb pie-chart… A lot more can be done in 2013 than in 1869, indeed, including the use of animated videos, but I remain somewhat sceptical as to the whole purpose of the book. It is a beautiful object, with wide margins and nice colour reproductions, for sure, alas… I just do not see the added value in work. I would even go as far as thinking this is an a-statistical approach, namely that by trying to produce as much data as possible into the picture, he forgets the whole point of the drawing which is I think to show the awful death rate of the Grande Armée along this absurd trip to and from Moscow and the impact of temperature (although the rise that led to the thaw of the Berezina and the ensuing disaster does not seem correlated with the big gap at the crossing of the river). If more covariates were available, two further dimensions could be added: the proportions of deaths due to battle, guerilla, exhaustion, desertion, and the counterpart map of the Russian losses. In the end, when reading I learned more about the history surrounding this ill-planned military campaign than about the proper display of data towards informative and unbiased graphs.

October 15, 2014 at 3:56 am
I just read the explanation of the pie chart at Friendly’s site. If that’s a true reflection of senior business leaders in Seth Godin’s experience (“… people who are too lazy to read the forty words…”) that’s truly shocking.
October 13, 2014 at 2:15 pm
I haven’t read Kraak’s book, but I had similar suspicions on seeing its content. I agree the Minard map is a wonderful example, especially taken in historical content, but I am a bit tired of Tufte’s hyperbole as it being “the best statistical graphic ever drawn” being promulgated. Even if it is the best map ever I’m skeptical how much of a teaching tool it can be just discussing one graph.
I wrote a critique of Kieran Healy and James Moody’s paper *Data Visualization in Sociology*, and in that paper they attempted to use the Minard graphic as a teaching example as well.