MCMC on zero measure sets
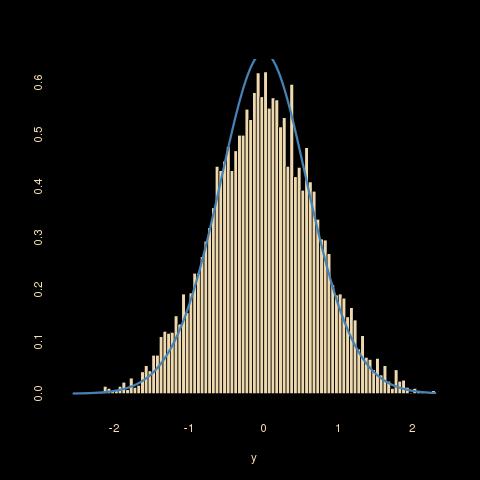 Simulating a bivariate normal under the constraint (or conditional to the fact) that x²-y²=1 (a non-linear zero measure curve in the 2-dimensional Euclidean space) is not that easy: if running a random walk along that curve (by running a random walk on y and deducing x as x²=y²+1 and accepting with a Metropolis-Hastings ratio based on the bivariate normal density), the outcome differs from the target predicted by a change of variable and the proper derivation of the conditional. The above graph resulting from the R code below illustrates the discrepancy!
targ=function(y){
  exp(-y^2)/(1.52*sqrt(1+y^2))}

T=10^5
Eps=3
ys=xs=rep(runif(1),T)
xs[1]=sqrt(1+ys[1]^2)
for (t in 2:T){
  propy=runif(1,-Eps,Eps)+ys[t-1]
  propx=sqrt(1+propy^2)
  ace=(runif(1)<(dnorm(propy)*dnorm(propx))/
               (dnorm(ys[t-1])*dnorm(xs[t-1])))
  if (ace){
     ys[t]=propy;xs[t]=propx
     }else{
       ys[t]=ys[t-1];xs[t]=xs[t-1]}}
If instead we add the proper Jacobian as in
  ace=(runif(1)<(dnorm(propy)*dnorm(propx)/propx)/
               (dnorm(ys[t-1])*dnorm(xs[t-1])/xs[t-1]))
the fit is there. My open question is how to make this derivation generic, i.e. without requiring the (dreaded) computation of the (dreadful) Jacobian.


November 19, 2017 at 1:36 am
A little late, but this may be of interest?
https://projecteuclid.org/euclid.imsc/1379942050
March 26, 2014 at 6:14 pm
This may be obvious to everyone else reading this, but I want to type it just to make sure I’m thinking it out correctly.
The problem is that, while the the proposal jumps are symmetric in “y”, they are not symmetric along the curve that you are sampling from, correct? Because the line integral along the path is not the same length for equal length segments in “y”, drawing a uniform point from y +/- EPS is not equivalent to drawing a uniform point centered at the current point on the x^2-y^2=1 line.
To properly adjust for sampling along the curve, you would want to parameterize the curve in terms of x(t) and y(t), draw a random length from L = runif(-EPS,+EPS), and solve (for T*):
L = line integral( sqrt(dx^2+dy^2)dt) from “current point” to T*
Then get x and y from x(t), y(t)
I think this would be uglier than just doing the variable transformation however…..
(feel free to tell me Im wrong, confusing, or just stating the obvious though)
March 26, 2014 at 9:57 pm
On the contrary Mike, I find your explanation completely to the point and most helpful! Using a random walk in the wrong space or with respect to the wrong dominating measure kills the validation of the simplified Metropolis step. The random walk one should use need keep invariant the measure on the curve, as you mention. Thank you!
March 28, 2014 at 9:51 am
Interestingly enough, while I would think the approach I hinted at up there should work, it doesn’t appear to upon testing it out.
The approach I mean is to draw a length L from a symmetric proposal distribution, then find the (propx,propy) pair that correspond to that move from the current point (x,y).
This should lead to a symmetric move that still satisfies the other conditions of MCMC. Unfortunately, unless I am doing something wrong in implementation, it still fails to return the right distribution for the problem above.
It works for simple test cases, and also appears to return the correct distribution for the “along the path” distribution, but the draws of y do not seem to correctly reflect the conditional distribution of y.
I did some tests in an R-markdown file and put it on RPubs if you are interested (link below). Unfortunately the writeup is not refined (at all, poorly commented, etc), so it may not be that helpful.
The main point is that the approach seems to work for some simple cases, but for reasons that are unclear to me, do not work for the other cases.
http://rpubs.com/mikegros/14906
March 28, 2014 at 12:34 pm
Dear Mike: did you check the code posted by Zen earlier today? It seems to be doing what you are suggesting, ie parameterising the curve x²-y²=1 to make those symmetric moves around and against the proper measure. I cannot tell from your description where or why things go wrong, but the major issue in this problem is to use the right dominating measure. Best, X.
March 28, 2014 at 8:32 pm
I did see his solution and noted it did work, I just find it interesting that the method I mentioned did not work (unless I just am implementing it wrong, which is possible).
The code I wrote isn’t so neat as to be easily legible, but I think the images and text around them tell the story. I hid the code so now it only shows the text and images. It’s possible that it is just an error on my end, but it is interesting to me nonetheless.
March 29, 2014 at 1:49 am
Hi, Mike. This is very interesting. Why don’t you post a question at http://stats.stackexchange.com/ ? Note that I used a parameterization of the hyperbola in which the velocity vector doesn’t have length one for every value of the parameter u. My guess is that we will have best results considering a finite (“big enough”) portion of the hyperbola, and using a natural parameterization (http://en.wikipedia.org/wiki/Differential_geometry_of_curves#Length_and_natural_parametrization). We could test this for conditioning events defined by other curves (ellipsis, parabola, etc).
March 30, 2014 at 11:01 am
Hi Zen,
I may post the question there soon.
I reposted the file at the RPubs link with the code for one section so you can see the sampling approach.
I also included my function to calculate the natural parameter iteratively. It appears to work in the tests I ran through it. I also calculated the natural parameter another way utilizing the R uniroot function, but what I show worked faster.
I’ll continue to disclaimer that I could just be doing something dumb or making a silly coding mistake, but if so, I haven’t figured out what it is yet.
March 30, 2014 at 10:08 pm
Dear Prof. Robert and Mike,
I’ve uploaded the lastest version here: http://www.ime.usp.br/~pmarques/R/hyperbola.r
Now I believe we are taking properly into account the geometry of the problem. The random walk is made “intrinsically”, stepping a random length along the hyperbola, in one of the two possible directions, at each iteration. It’s slow because I’m using R’s integrate() and uniroot() to solve the integral equation related to the arc length. The result looks good.
Cheers.
March 31, 2014 at 7:27 pm
Hi Zen,
I’m not sure that the fact your move is uniform on the hyperbola is the key point. For example, if I replace your proposal with just a uniform perturbation of u:
candidate <-function(t01,L) {
return(L+t01)
}
the fit of the resulting histogram of MC realizations is still an excellent fit to the target. I think you have implicitly defined a transformation that has constant Jacobian. If you consider the transformation from (X,Y) to (U,Z) such that X=sqrt{Z} cosh(U) and Y=sqrt{Z} sinh(U), then I get a constant Jacobian. This leads us to
f(U|Z) \propto f(U,Z) \propto f(X,Y)
so that the Metropolis-Hastings ration in Christian's original code is correct.
Hope this makes sense. Let me know if you see any flaws in my reasoning.
Best,
Brad
April 1, 2014 at 12:03 am
Hi Brad, that’s what I did in the code contained in my comment of March 27, 2014 at 9:53 pm (see bellow). Thanks.
March 26, 2014 at 4:09 am
Hi, Prof! Is the conditioning event just the right sheet of the hyperbola ($x\geq 1$) or both sheets?
March 26, 2014 at 9:21 am
sorry, I do not understand your question…
March 26, 2014 at 5:19 pm
$x^2-y^2=1$ defines a hyperbola with two sheets: one with $x\geq 1$, and another with $x\leq -1$.
March 26, 2014 at 5:27 pm
oh indeed… thanks, I was not aware of the use of “sheet” in English. We use “branch” in French. Now, in the current case, picking either sheet does not make a difference because the Gaussian is centred at zero and hence symmetric in x. As you can read from the R code, I picked the positive side for x. For a non-centred normal, the construct and Jacobian would be a bit more involved. Albeit manageable…
March 26, 2014 at 5:42 pm
Sorry for the sheet! Is it worth flipping a coin every time to decide if we should “warp” to the other branch of the hyperbola?
March 26, 2014 at 5:45 pm
no really, because we do not simulate the x, simply use the density of x (equal to the density of -x) in the resulting projected density of y. If we were to simulate x instead of y, the same would occur.
March 26, 2014 at 5:51 pm
I see. The warping would be (maybe) useful only if the distribution were not symmetric. Thanks!
March 27, 2014 at 11:51 pm
Revised code:
N <- 10^5

eps <- 1.5

u <- numeric(N)

for (i in 2:N) {

  v <- u[i - 1] + runif(1, -eps, eps)

  if (runif(1) < dnorm(sinh(v))*dnorm(cosh(v))/dnorm(sinh(u[i - 1]))/dnorm(cosh(u[i - 1]))) {

      u[i] <- v

  } else {

      u[i] <- u[i - 1]

  }

}

hist(sinh(u), breaks = "FD", xlab = "y", freq = FALSE)

curve(dnorm(x, mean = mean(sinh(u)), sd = sd(sinh(u))), col = "blue", lwd = 2, add = TRUE)
March 27, 2014 at 9:53 pm
Using hyperbolic functions to parameterize the hyperbola.
N <- 10^5
eps <- 1.5
u <- numeric(N)
for (i in 2:N) {
v <- u[i – 1] + runif(1, -eps, eps)
if (runif(1) < dnorm(sinh(v))*dnorm(cosh(v))/dnorm(sinh(u[i – 1]))/dnorm(cosh(u[i – 1]))) {
u[i] <- v
} else {
u[i] <- u[i – 1]
}
}
hist(sinh(u), breaks = "FD")
March 30, 2014 at 1:03 pm
Maybe one idea is to draw uniformly a sample on the curve (as in the previous answer, I guess),
Regards,
Luca
March 24, 2014 at 12:41 pm
Good to read about this problem here, Christian. I’ve been working on a similar problem in a Finance context with Gareth Peters and we will be presenting some of our progress at the MCQMC in Belgium: http://mcqmc2014.cs.kuleuven.be/program/abstract/?aid=121&akey=ac0156c0876059bc08474ed12bc5b1f0
Hope to see you there!
Best,
Rodrigo
PS: Sorry for using your blog to advertise our talk! :)
March 24, 2014 at 5:15 pm
Great news, Rodrigo! Will definitely chat with you about this in Leuwen. See you there.
March 24, 2014 at 7:02 am
[…] article was first published on Xi'an's Og » R, and kindly contributed to […]