 David Bellhouse has written a new book on the history of statistics, focussing on William Playfair this time (following his fantastic book on Abraham de Moivre). The Flawed Genius of William Playfair (The Story of the Father of Statistical Graphics) got published a few months ago by the University of Toronto Press.
“[Playfair] was an ideas man whose ideas often did not come to fruition; or, when they did, they withered or exploded.” [p.121]
The impressions I retained from reading this detailed account of a perfect unknown (for me) are of a rather unpleasant, unappealing, unsuccessful, fame-seeking, inefficient, short-sighted, self-aggrandising, bigoted, dishonest, man, running from debtors for most of his life, with jail episodes for bankruptcy, while trying to make a living from all sorts of doomed enterprises, short-lived blackmailing attempts, and mediocre books that did not sell to many. Similar to David Bellhouse’s colleague earlier wondering at the appeal of exposing such a rogue character, I am left with this lingering interrogation after finishing the book…
“[Richard] Price liked what Playfair had written. He found [in 1786] Playfair to be “agreeable” and “useful”.” [p.64]
Not that I did not enjoy reading it!, as it gives a most interesting of the era between the 18th and the 19th Centuries, in particular in its detailed narration of the first months of the French Revolution of 1789, and of the impact of the Industrial Revolution on economics and politics as the birth of capitalism. The book abounds in crossing lots of historical characters, like Richard Price (Bayes’s friend who published his most famous paper), Adam Smith (whose book Playfair reprinted with poor additions), Edward Gibbons (whose book along with Smith’s inspired the title of his Inquiry Into the Permanent Causes of the Decline and Fall of Powerful and Wealthy Nations), Thomas Malthus (competing for an annotated edition of Smith’s book), not to mention the political class of Britain at the time. David Bellhouse’s book demonstrates academic and historical excellence, constantly being very detailed, with a wealth of references, documents, and definite support for or against the rumours that accompany the life and deeds of Playfair. (Frankly, rarely a name has been that inappropriate!) This includes for instance the pictures pointing out to his first (?) forged signature [p.140] and the evacuation of the myth of Playfair as a spy for the British Crown—which the Wikipedia page happily reproduces, pointing out the need for an in-depth revision of said page. Similarly, the book delivered a convincing discussion of arguments for and mostly against Playfair “being the key player in the British operation to forge [French] assignats” towards destroying its economy. A lot of the book is touching upon the then novel issue of paper money, which Playfair only and negatively considered through his own (and catastrophic) experiences. At times, the book is almost too scholarly as it makes reading less fluid than was the case his Abraham de Moivre for instance. (And obviously less than in the contemporary Jonathan Strange & Mr. Norrel!) 
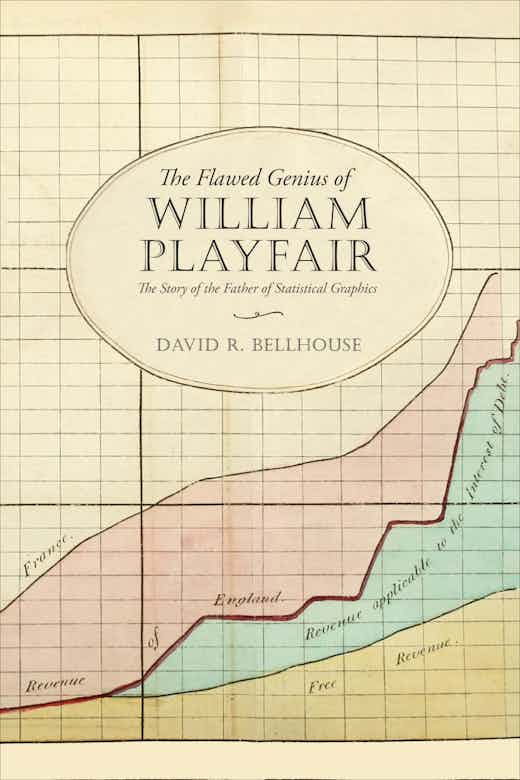
It may be that my very relative lack of enthusiasm stems from the realisation that the story of Playfair is overall rather little connected with statistical inference, if not with descriptive statistics (albeit with a complete disregard for the quality and sources of his data), as when publishing a Statistical Breviary on descriptive statistics for a series of countries (and surprisingly sold on Amazon!). Or Statistical Account of the United States of America. And of course for his innovative graphical representations like the one represented on the cover of the book or the pie chart. I feel that the book is much more engaged in Playfair’s contributions to the then nascent science of economics, as for instant about the shallow and mostly misguided views of his’ on banking and running the economy, while conducting his personal finance and investments so disastrously that it negatively advertised against confidence in such views.
On a very personal level, I noticed that some graphs were provided by my friend and statistics historian Stephen Stigler [who also wrote a review of the book] while an analysis of the poor French involved in a coding scam of Playfair about Napoléon’s escape from Elba was by Christian Genest (whom I first met at a statistics conference dinner on the Lac de Neufchâtel in 1986).
[Disclaimer about potential self-plagiarism: this post or an edited version will eventually appear in my Books Review section in CHANCE. As appropriate for a book about Chance!]


